ARM Frequently Used Info (FUI)
Most of this text comes form Joseph Yui's Book.
SITE HOME
SW tools
1. Keil
-> ULINK Keil's debug
adapter
2. mbed.org
-> I-Jet
3. IAR Systems
4. Code-Red Technologies.
Examples of built-in USB debug adaptor:
The CMSIS-DAP from ARM
CoLink from Coocox
What is a debug-adaptor:
In order to download your program code to the microcontroller, and
to carry out
debug operations like halting and single stepping, you might need a
debug adaptor to convert a USB connection from your PC to debug
communication protocol used by the microcontrollers. Most C compiler
vendors have their own debug adaptor
products. For example, Keil� has the ULINK product family (Figure
2.2), and
IAR provides the I-Jet product.
Some of the development kits already have a USB debug adaptor
built-in on the
board.
Software Device Driver:
Software written to read/write to peripheral registers.
Object File:
In most cases, a project contains a number of files that are
compiled separately. After the compilation process, each source file
will have a
corresponding object file. In order to generate the final combined
executable
image, a separate linking process is required. After the link stage,
the IDE can
also generate the program image in other file formats for the
purpose of programming the image to the device.
Flash programming:
Almost all of the Cortex�-M microcontrollers use flash
memories for program storage. After a program image is created, we
need
to download the program to the flash memory of the microcontroller.
To do
this, you need a debug adaptor if the microcontroller board you use
does not
have one built in. The actual flash programming procedures can be
quite
complex, but these are usually fully handled by the IDE and you can
carry out
the whole programming process with a single mouse click. Note that
if you
want to, you can also download applications to SRAM and execute them
from there
Execute program and debug:
After the compiled program is downloaded
to the microcontroller, you can then run the program and see if it
works.
You can use the debug environment in the IDE to stop the processor
(commonly referred as halt) and check the status of the system to
ensure it is
working properly. If it doesn’t work correctly, you can use various
debug
features like single stepping to examine the program operations in
detail. All
these operations will require a debug adaptor (or the one built in
to the
development kit if available) to link up the IDE and the
microcontroller being
tested. If a software bug is found, then you can edit your program
code,
recompile the project, download the code to the microcontroller, and
test
it again
During execution of the compiled program, you can check the program
execution
status and results by outputting information via various I/O
mechanisms such as a
UART interface or an LCD module. A number of examples in this book
will
show how some of these methods can be implemented. See Chapter 18
for some
of the examples
Following diagram comes from Joseph Yui's Book:

The above flow is different from the GNU 'gcc' based flow which
looks like the following:
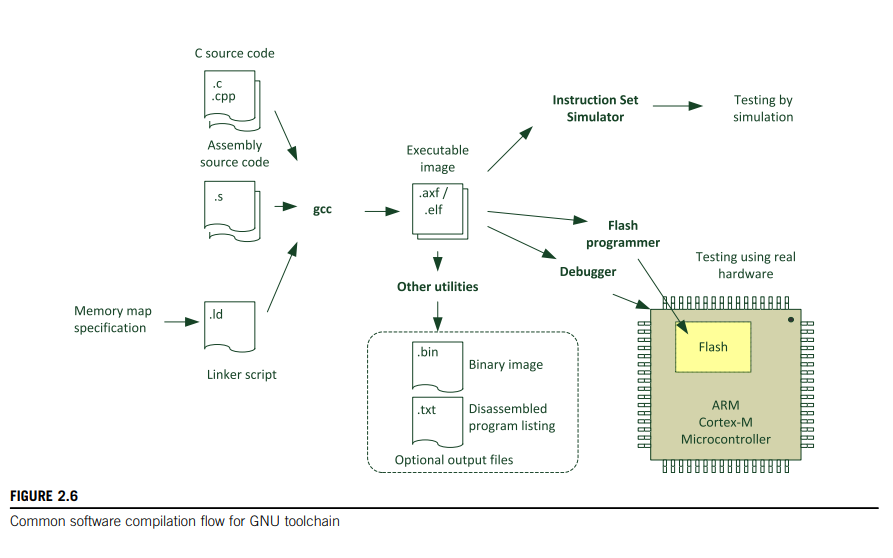
The main difference being the Linking process. The GNU based process
is single step, while the first one has separate linking process.